Geospatial stories, told with open data
Earth Unfolded uses maps and publicly available data to explore how places change across time and space. Follow a flood across a landscape, compare mangrove cover over time, or look closer at a protected area. Start with one of the dashboards below. Each one shows where its data comes from, what it reveals and what it cannot tell us.
Latest
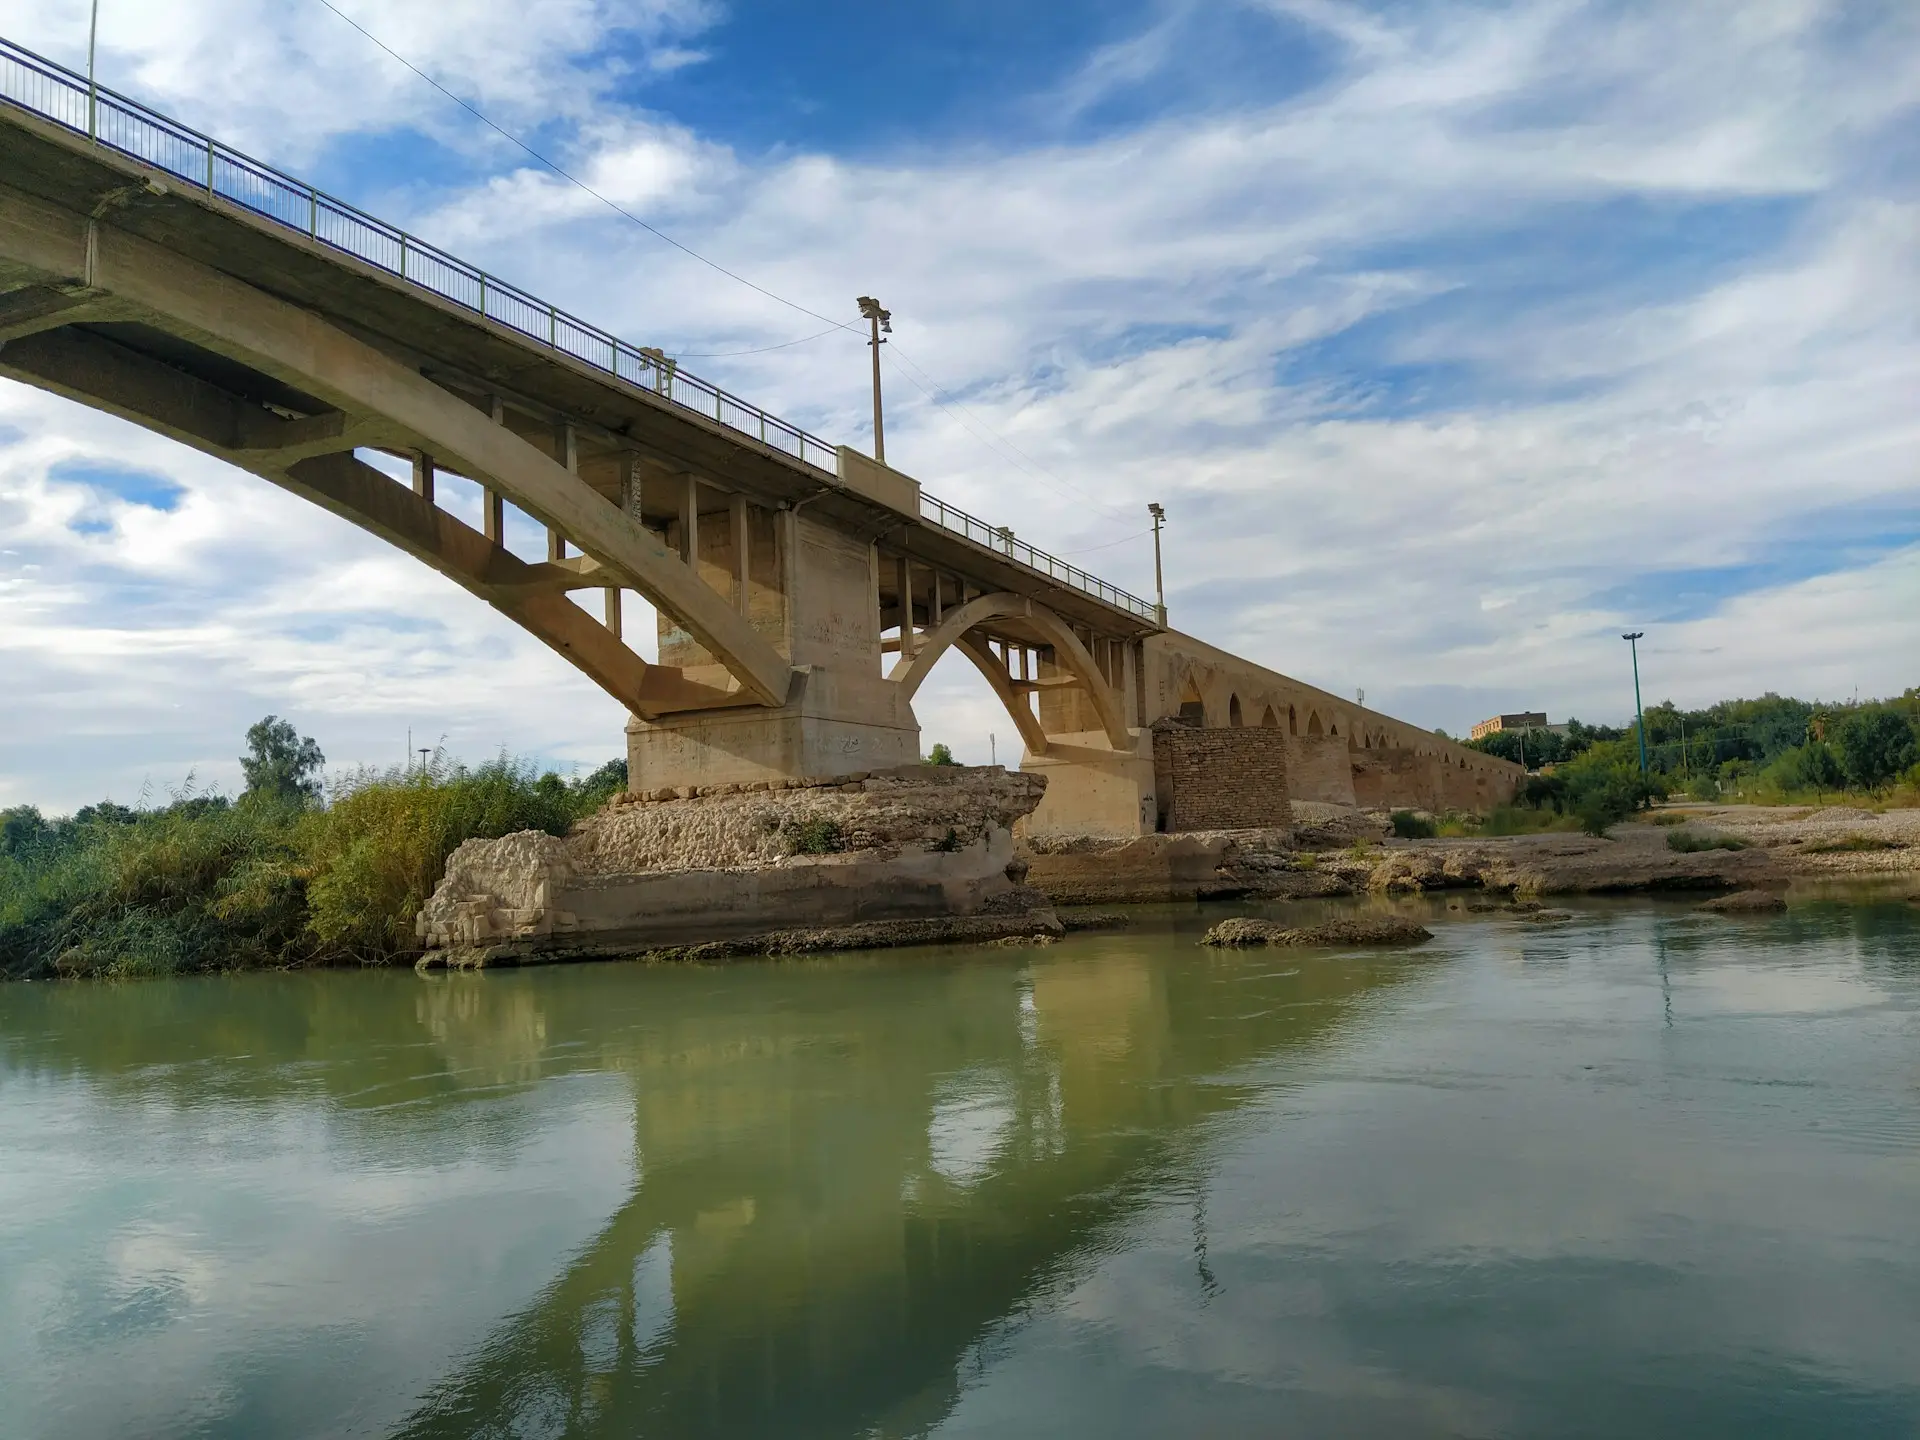
Mapping the 2019 Iran flood, a case study in Khuzestan province
Mapping the 2019 Khuzestan flood using publicly available satellite imagery. Estimating the exposure of people and infrastructure within the flooded area.
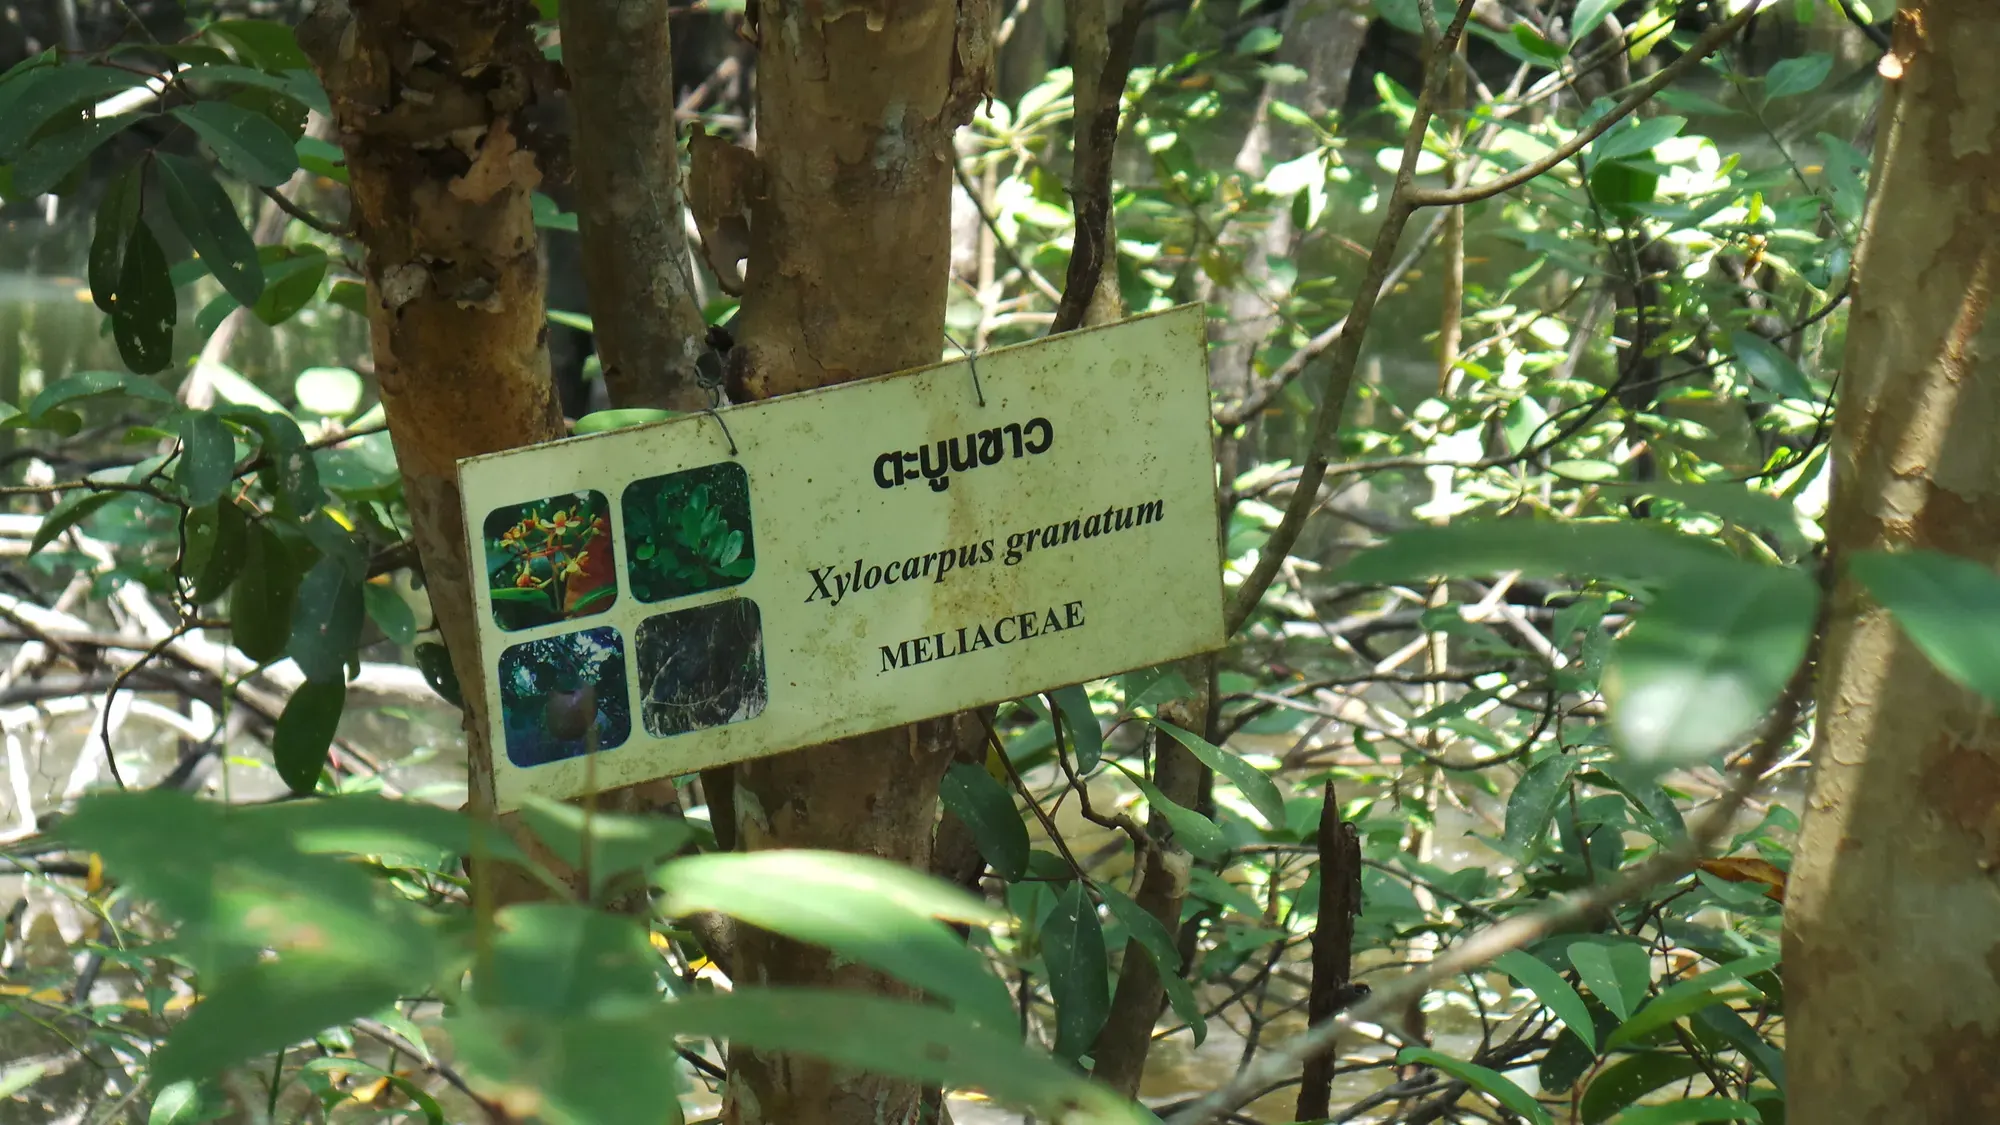
Mangroves and protected areas
Mangrove extent inside and outside protected areas, 1985 to 2025, by country.