Dashboard ·
Mangroves and protected areas
Mangrove extent inside and outside protected areas, 1985 to 2025, by country.
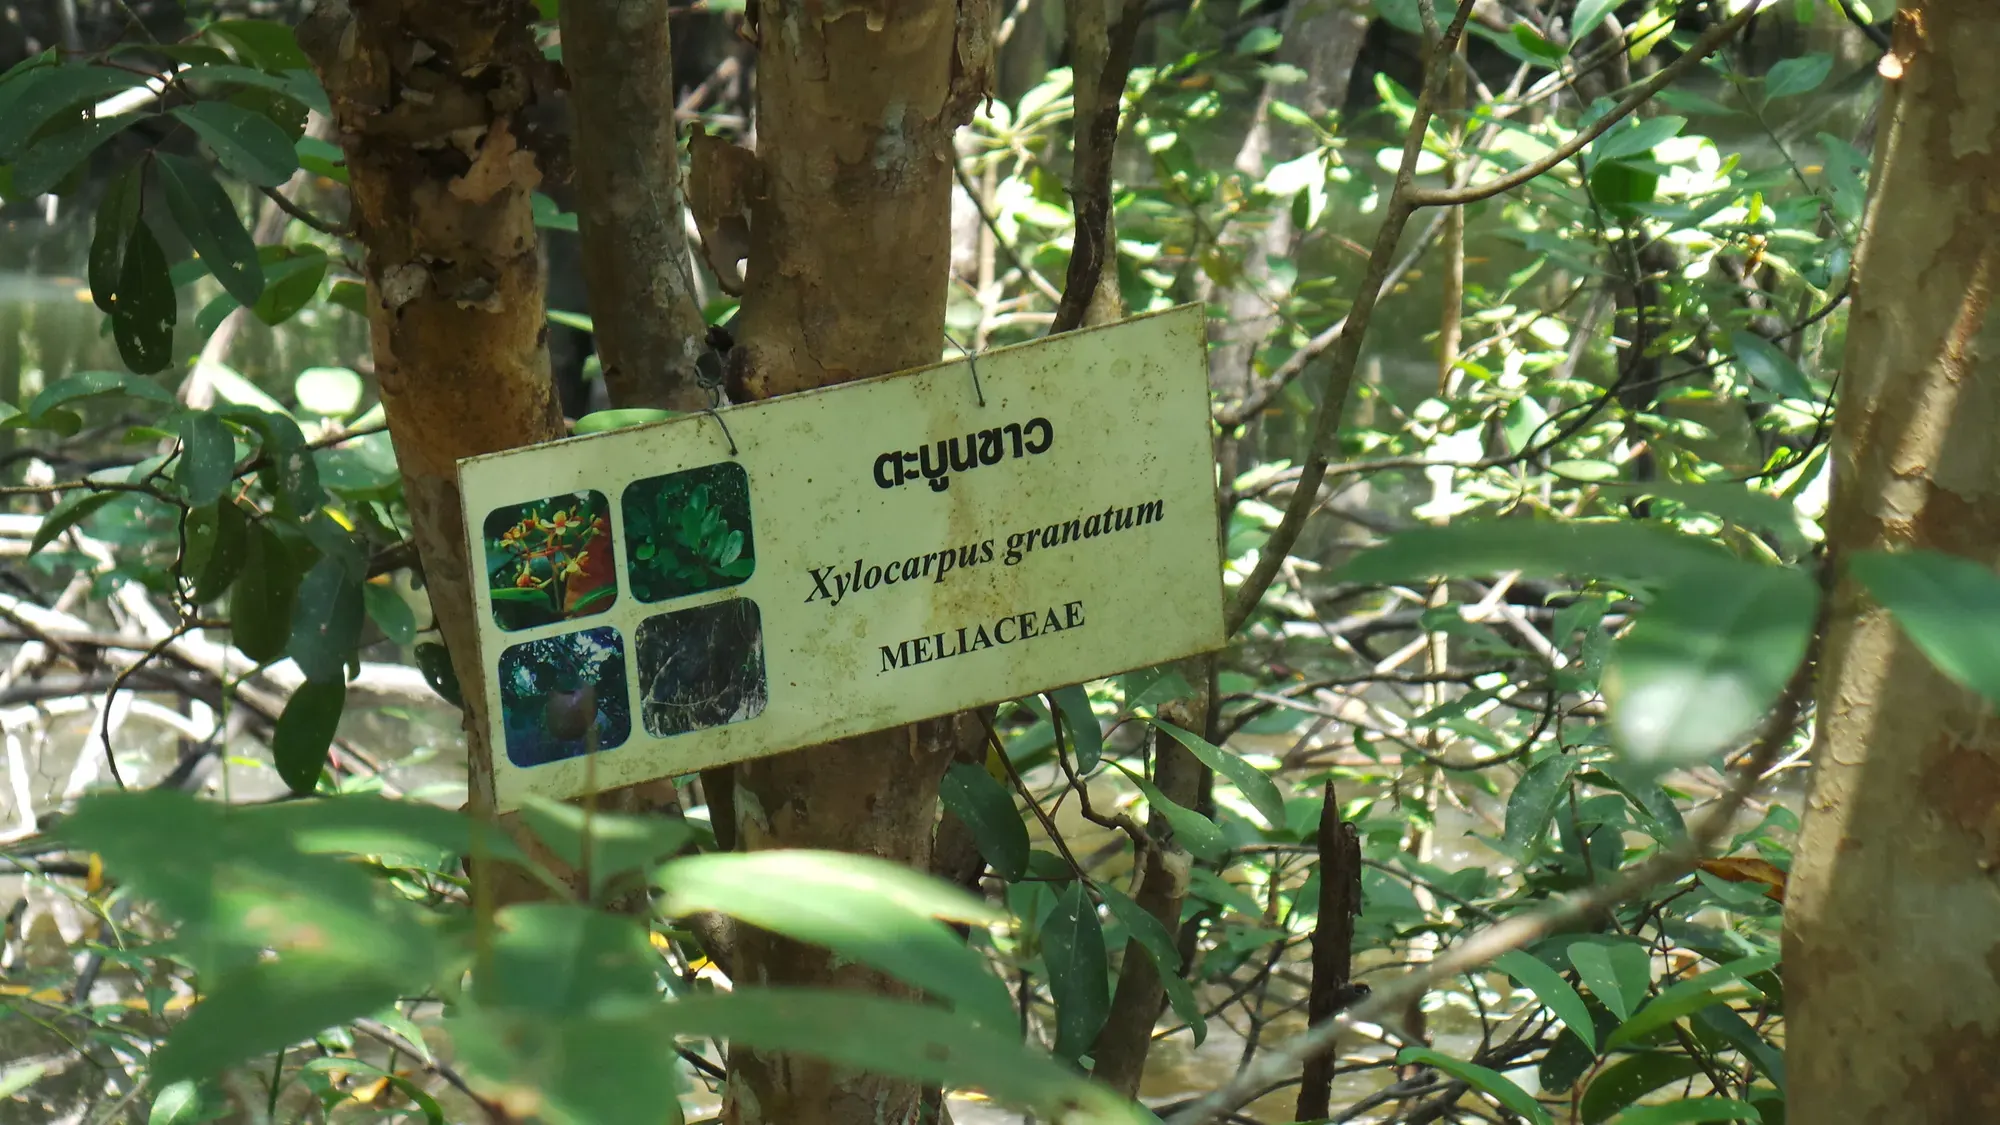
Mangroves shelter fish, store carbon and help protect tropical coastlines. How much remains, and how much lies inside ?
Global Mangrove Watch (GMW) maps mangroves yearly from 1985 to 2025. Researchers at Aberystwyth University and soloEO use and images alongside radar observations. Their maps show changes along coasts worldwide.
The World Database on Protected Areas ( ) records boundaries supplied by governments and other organisations. and bring them together globally. We overlay these boundaries on the maps.1
The dashboard shows remaining cover, changes and places worth investigating. It cannot tell us whether protection caused a change. A remote reserve might have lost less mangrove anyway. Testing this needs protected and unprotected places.
Contents
- The global picture
- Does the type of protection matter?
- Compare countries
- Explore the map
- Notes
- References
- Data sources
The global picture
In 2025, GMW mapped about Global Mangrove Watch mapped 150,674.7 km² of mangrove worldwide in 2025. of mangrove worldwide. That is The world lost a net 1,920.0 km² of mangrove between 1996 and 2025. less than in 1996, a of The net mangrove loss between 1996 and 2025 is 1.3% of the 1996 extent. . The net figure hides 20,371.5 km² of mangrove present in 1996 was gone by 2025. lost and 18,451.5 km² of mangrove present in 2025 was not there in 1996. gained elsewhere.2 By 2010, around 60.1% of the net mangrove loss between 1996 and 2025 had happened by 2010. of the net loss since 1996 had occurred. Cover later rose and fell; between 2015 and 2025, it grew by about Global mangrove extent grew 0.99% between 2015 and 2025. .
The inside protected areas rose from 18.7% of the world's mangrove lay inside a protected area established by 1996. in 1996 to 38.9% of the world's mangrove lay inside a protected area established by 2025. in 2025. That is about 28,555.6 km² of mangrove lay inside a protected area established by 1996. then and 58,615.8 km² of mangrove lay inside a protected area established by 2025. now. In 2025, 2,861 protected areas held mangrove in 2025, a protected area counted once per country it lies in. recorded protected areas held mangrove.3 The increase in protected share reflects new designations and changes in cover, not proof of protection’s effect.
The charts show cover and change over time. Switch views to see gains and losses against the . Protected areas count from their recorded , using their December 2025 boundaries. Areas without a year are excluded from yearly protected-share figures.4
- Lost
- —
- Gained
- —
Global mangrove extent
Does the type of protection matter?
The WDPA records a for many protected areas. Here, categories Ia, Ib and II form the .5 Categories III to VI form . Areas without a reported category have their own group. The chart compares mangrove loss inside these groups and outside protected areas.
From 1996 to 2025, averaged Mangrove inside strict reserves was lost at 0.29% a year of its 1996 extent between 1996 and 2025. of starting cover in strict reserves. Outside protected areas, it averaged Mangrove outside protected areas was lost at 0.54% a year of its 1996 extent between 1996 and 2025. . Loss outside ran about Gross mangrove loss outside protected areas ran 1.6 times faster than inside between 1996 and 2025. faster than inside protected areas overall. Even so, 28.0% of the gross mangrove loss between 1996 and 2025 fell inside protected areas. of fell inside protected areas. These differences show where loss occurred, not what a reserve prevented.
Gross loss rate by protection type since 1996
Loss does not necessarily mean deforestation. Erosion, storms and shifting sediment can remove mangrove. So can clearing. Gains may come from sediment, regrowth or planting. The maps cannot tell us why.
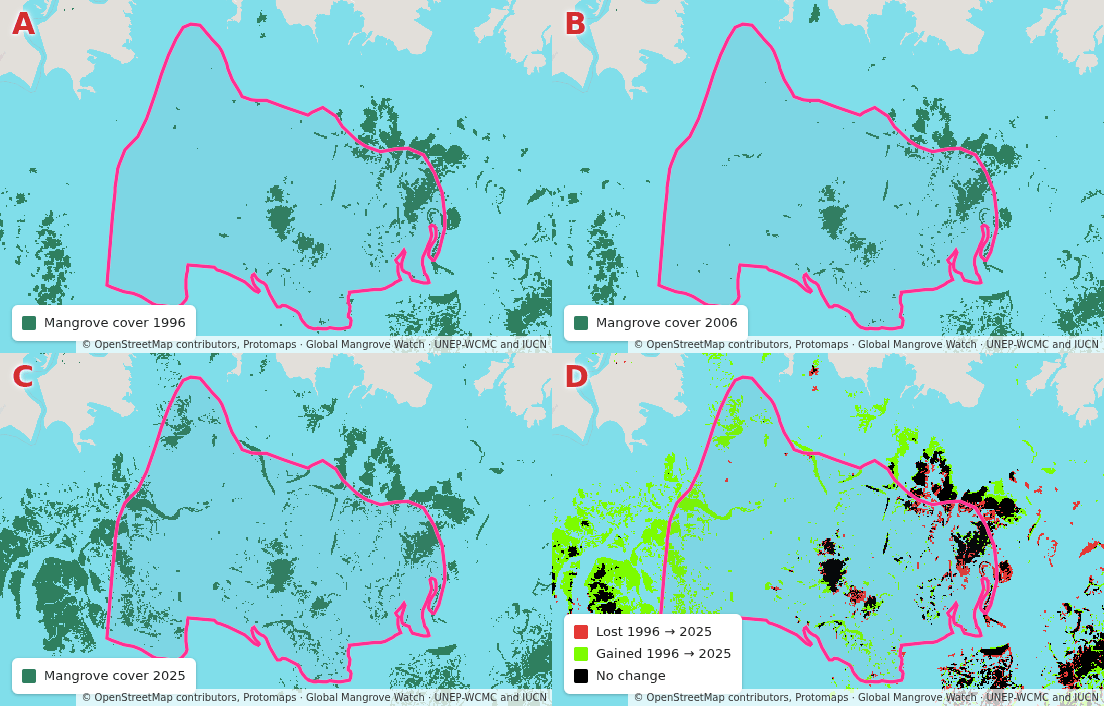
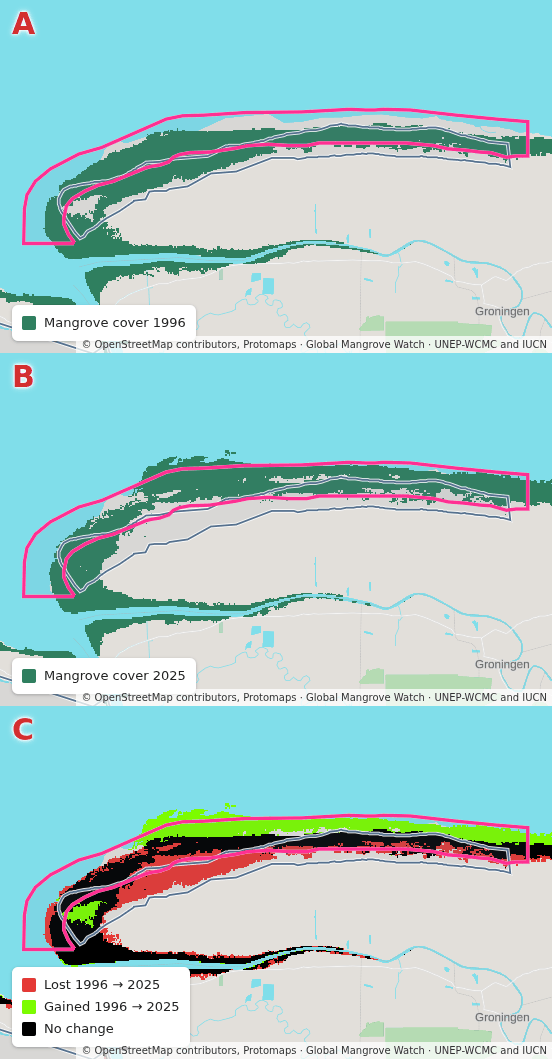
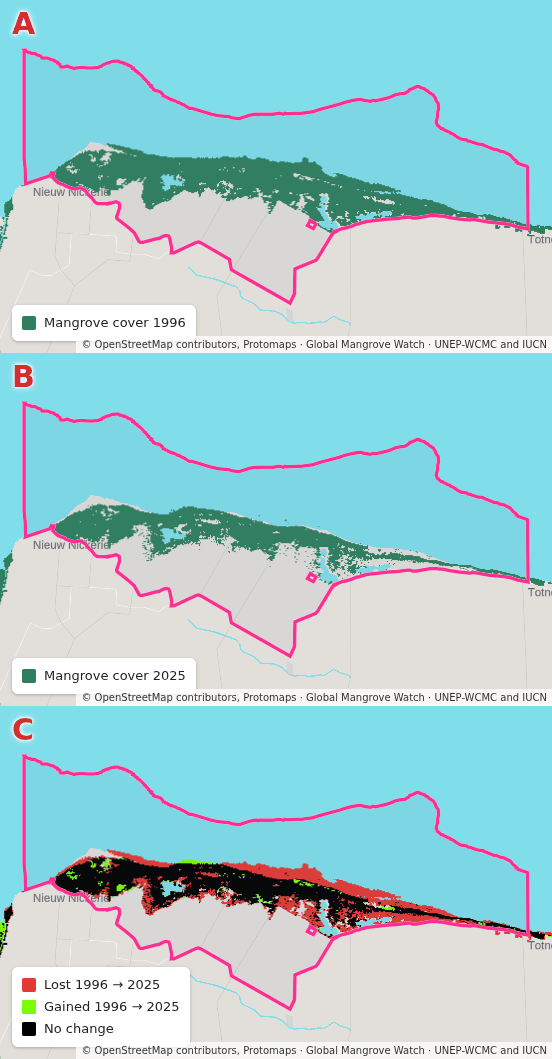
The three animations put that movement into view. Keti Bunder South in Pakistan lost mangrove by 2006, then grew again. Its 2025 cover was Keti Bunder South, a protected area in Pakistan, grew its mangrove 51.7% between 1996 and 2025. above its 1996 cover. In Suriname, Coppename Monding gained Coppename Monding, a protected area in Suriname, grew its mangrove 13.7% between 1996 and 2025. , while Bigi Pan lost Bigi Pan, a protected area in Suriname, lost 45.6% of its 1996 mangrove by 2025. , or about Bigi Pan, a protected area in Suriname, lost a net 120.6 km² of mangrove between 1996 and 2025. . These are changes inside protected areas, not evidence that protection caused them.
Compare countries
Indonesia holds about Indonesia held 21.4% of the world's mangrove in 2025. of the world’s mangrove but protects only 7.8% of Indonesia's mangrove lay inside a protected area in 2025. of its own. It accounts for about Indonesia accounts for 26.5% of the gross mangrove loss between 1996 and 2025. of gross loss since 1996. Indonesia, Myanmar, Mexico, Nigeria and Brazil together account for Indonesia, Myanmar, Mexico, Nigeria and Brazil account for 53.4% of the gross mangrove loss between 1996 and 2025. of that loss. Mexico and Brazil account for Mexico accounts for 16.2% of the gross mangrove loss inside protected areas between 1996 and 2025. and Brazil accounts for 14.3% of the gross mangrove loss inside protected areas between 1996 and 2025. of loss inside protected areas, respectively.
The protected share does not predict a country’s trend. Bangladesh has 91.6% of Bangladesh's mangrove lay inside a protected area in 2025. inside protected areas and Bangladesh's mangrove extent fell 0.1% between 1996 and 2025. since 1996. Pakistan has 31.8% of Pakistan's mangrove lay inside a protected area in 2025. inside protected areas and gained Pakistan's mangrove extent grew 81.4% between 1996 and 2025. . Brazil’s protected share rose from 59.7% of Brazil's mangrove lay inside a protected area established by 1996. to 88.6% of Brazil's mangrove lay inside a protected area established by 2025. , while its cover grew by just Brazil's mangrove extent grew 0.3% between 1996 and 2025. . Suriname has 54.6% of Suriname's mangrove lay inside a protected area in 2025. inside protected areas and lost Suriname's mangrove extent fell 22.0% between 1996 and 2025. of its mangrove.
Of the 110 countries held mangrove in 2025. countries with mangrove in 2025, 42 of the 110 countries with mangrove protected under 30% of it in 2025. have less than Target 3 of the Kunming-Montreal Global Biodiversity Framework is at least 30% of land and of sea conserved by 2030. Convention on Biological Diversity (2022). Kunming-Montreal Global Biodiversity Framework, decision 15/4 of the Conference of the Parties. CBD/COP/DEC/15/4. https://www.cbd.int/doc/decisions/cop-15/cop-15-dec-04-en.pdf inside protected areas. The international concerns land and sea conservation, not mangroves specifically. It is shown here for comparison, not as a mangrove target.
- In 1996
- —
| Country | Mangroves, 2025 | Protected, 2025 | Protected share, 2025 | Protected areas, 2025 | Change since 1996 |
|---|
Search or sort the table, then select a country to move the map. Its chart shows cover from the baseline to the year. Switch to Changes for gains, losses and net change from the baseline to each later year.
Explore the map
Choose a year and an earlier baseline. The figures follow those choices. maps current mangrove.6 shows loss in red, gain in light green and unchanged mangrove in black. Blue outlines mark protected areas.
Search the map for a country, then select a protected area. A second chart shows its cover by year, or change from the baseline to each later year. Try Bigi Pan and Coppename Monding, two nearby areas with different histories.
Older GMW maps fill gaps using nearby years. WDPA boundaries show their 2025 shapes, not every past boundary. These charts raise questions; they cannot settle what caused a change.
- Indonesia
- Mangrove cover 2025
Indonesia
Pick a protected area on the map to chart it here.
Notes
- Protected areas the WDPA records as proposed are left out of every figure and of the map. In 2025, 163 protected areas holding mangrove in 2025 are recorded as proposed and count toward no figure, a protected area counted once per country it lies in. proposed protected areas held mangrove, and 905.9 km² of mangrove in 2025 lay inside a proposed protected area and inside no other. of mangrove lay inside a proposed protected area and no other. ↩
- A pixel counts as change between two years only, so loss and regrowth inside a gap between surveys is not seen. ↩
- A protected area on a border is counted once per country, so this count exceeds the count of distinct protected areas. ↩
- Counted whatever its establishment year, protected mangrove in 2025 was 65,432.9 km² of mangrove lay inside a protected area in 2025, counting every protected area in the December 2025 release but the proposed ones, whatever its establishment year. , 43.4% of the world's mangrove lay inside a protected area in 2025, counting every protected area in the December 2025 release but the proposed ones, whatever its establishment year. of the extent, against 38.9% of the world's mangrove lay inside a protected area established by 2025. under the rule. The difference is 711 protected areas holding mangrove in 2025 have no establishment year, a protected area counted once per country it lies in. protected areas with no establishment year. ↩
- Strict reserves are IUCN Ia, Ib and II, the grouping of Joppa and Pfaff (2009). The IUCN guidelines rank no category above another. ↩
- The map draws at 38 m, so a map pixel under half covered by mangrove is not drawn. ↩
References
- Convention on Biological Diversity (2022). Kunming-Montreal Global Biodiversity Framework, decision 15/4 of the Conference of the Parties. CBD/COP/DEC/15/4. https://www.cbd.int/doc/decisions/cop-15/cop-15-dec-04-en.pdf
Data sources
- Global Mangrove Watch: Timeseries of Mangrove Extent, version 4.1, Aberystwyth University and soloEO, for the Global Mangrove Alliance, version 4.1.12, CC-BY-4.0
- World Database on Protected Areas, UNEP-WCMC and IUCN, version 2025-12, Protected Planet Terms and Conditions
- OpenStreetMap planet snapshot, OpenStreetMap contributors, version 2026-08-17, ODbL-1.0
- Natural Earth vector, GeoPackage package, Natural Earth, version 5.1.2, public domain
- Coastline water polygons, split, Mercator, osmdata.openstreetmap.de, version 2026-08-25, ODbL-1.0
- Land polygons, split, Mercator, osmdata.openstreetmap.de, version 2026-08-25, ODbL-1.0
- Daylight landcover, vectorised, Protomaps, from the Daylight Map Distribution, version 2026-08-24, CC-BY-4.0
- Wikidata QRank, Sascha Brawer, on Wikimedia Toolforge, version 2026-08-24, CC0-1.0
- Positioned Glyph Font encodings, wipfli, version 2026-08-24, MIT